
The Florida Department of Economic Opportunity released January 2021 employment data as well as revised employment data for all of 2020. The following key takeaways from the monthly jobs report focus on the most recent data available for the Orlando region.
As we seek to help the region navigate the economic disruption, we have insights into new economic data to share with you. This week the Florida Department of Economic Opportunity released January 2021 employment data as well as revised employment data for all of 2020, based on a revision of the Federal Government’s labor force models.
The following key takeaways from the monthly jobs report focus on the most recent data available for the Orlando region (Lake, Orange, Osceola and Seminole Counties). This month we highlight how these revisions to the 2020 data point to an even greater need to focus on workforce upskilling and economic diversification.
Job Loss and a Lower Unemployment Rate
Since the height of job losses in May 2020, the Orlando region has regained 71,000 jobs, mainly in Leisure and Hospitality (38,900), Retail Trade (13,200), and Professional and Business Services (9,500). This is the same as saying the region has recovered 28 percent, more than one in four, of the jobs lost due to the pandemic. See Figure 1 below for the overall look at net employment loss against a pre-pandemic baseline.
While close to 39,000 jobs have been regained in Leisure and Hospitality, this industry is simultaneously the most impacted. As of January 2021, 40 percent of the jobs that existed in Leisure and Hospitality before the pandemic are no longer available, which equates to 112,100 jobs. The revised 2020 data also shows that no industry, either in Orlando or the U.S., has reached employment levels above a pre-pandemic baseline. See Figure 2 below.
On a positive note, the annual revisions to the labor force data also resulted in revised unemployment rates, inching Orlando’s rate lower than the National average. Orlando currently has an unemployment rate (not seasonally adjusted) of 5.8 percent and December’s rate was revised down to 4.2 percent, much lower than the previously reported 6.9 percent. These revisions put Orlando’s unemployment rate lower than the current U.S. rate of 6.6 percent and closer to the Florida rate of 5.3 percent. See Figure 3 below for the revised regional, state, and national unemployment rates.
Implications
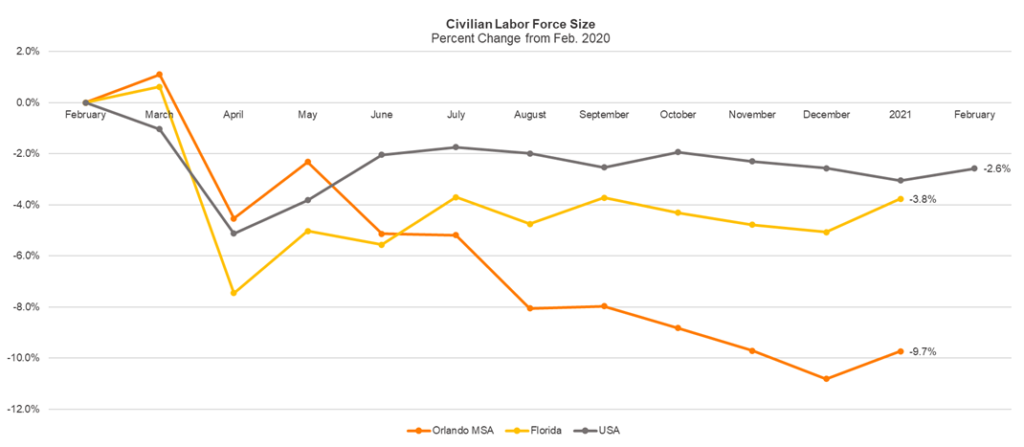
This persistent lack of jobs in what was previously Orlando’s largest industry is likely contributing to a loss of low wage, young workers who are leaving the region entirely. Orlando’s labor force is roughly 10 percent smaller than it was in February, a drop-off much higher than what has been experienced at the state and national level. See Figure 4 below. This suggests that beyond the national trend of women leaving the labor force and disgruntled job seekers dropping out of the labor force altogether, workers who previously held jobs in the Leisure and Hospitality industry are moving out of the region entirely. Insights from the Pew Research Center show that pandemic-related movers are more likely to be young adults or who move for financial reasons.
This would explain Orlando’s larger-than-average labor force loss. Rather than waiting for employment opportunities to reappear in their previous roles, displaced workers are competing for the smaller number of remaining jobs or moving out of the region. These trends underscore the importance of diversifying job types available to Orlando residents and highlight challenges related to the scale of workforce upskilling and reskilling necessary over the next 10 years. A recent report by McKinsey highlighted that, “17.1 million Americans may need to switch occupations by the end of the decade – up from 13.4 million before the pandemic.” This applies across all industries and occupations, not only Leisure and Hospitality. Workforce data for February will be available on March 26 and we will continue to update you as these trends progress.
Visualizations depicting this data are included below.
Figure 1 – Net Employment Change
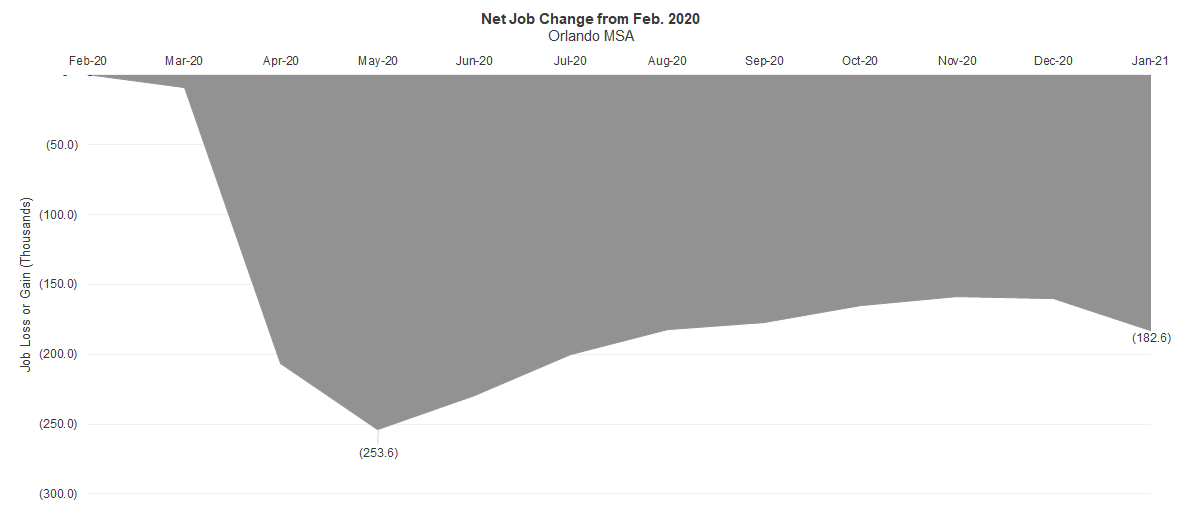
Figure 2 – Industry Employment, Jobs Lost or Gained in Each Industry
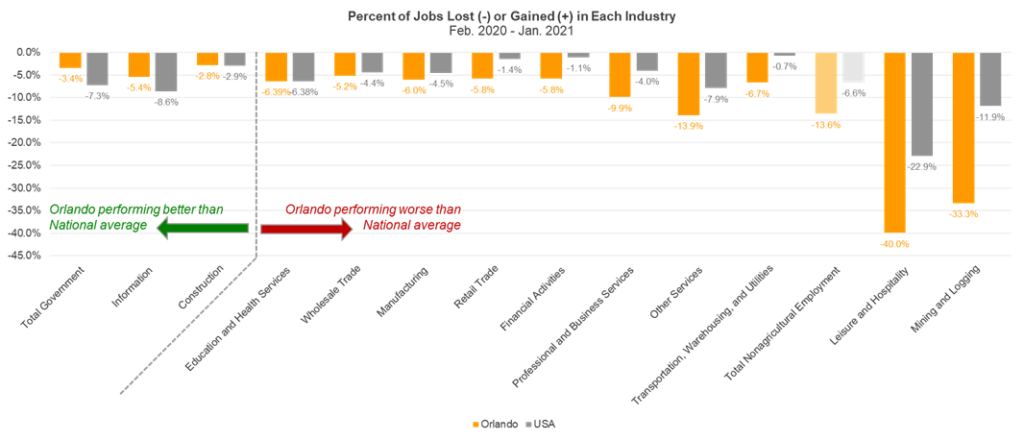
Figure 3 – Unemployment Rate
February rates for the MSA and State will be released on March 26
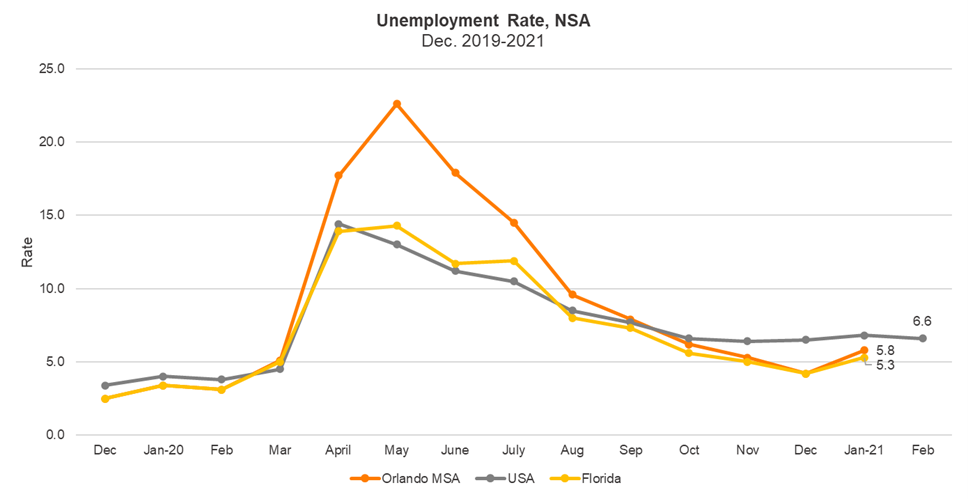
Figure 4 – Size of the Regional Labor Force