
A weekly update to high-frequency indicators through September 18 that will signal worsening or better economic recovery outcomes for the Orlando region.
In this weekly, special edition of the metro Orlando Market Overview, the Partnership research team analyzes select, high-frequency indicators* that will signal worsening or better outcomes for the region. The signs of a deepening recession or the beginning of a recovery will appear in these indicators before they are seen in a wider set of data sources.
Of note, the National Bureau of Economic Research officially declared the US economy in a recession on Monday, June 8. Starting in February, this recession ends a decade-long period of economic expansion and the longest in recorded US history.
The metrics provided below will be updated in new posts on a weekly basis by the research team with the latest data available.
*Lags in data collection and publishing mean that many economic indicators will not begin to quantify the effects of a COVID-19 recession on the Orlando region until Q3 2020 and beyond.
| Unemployment Rate | New Claims for Unemployment Insurance | Month to Month Job Change | Week to Week Job Postings | |
| Metric | 11.0% | 3,260 | 14,400 | 4,908 |
| Rate of Change | -4.4% MoM | -4.4% WoW | +1.2% MoM -9.0% YoY | -11.7% WoW |
| Date Range | August | September 12 | July-August | September 12 |
| Released | Monthly | Weekly | Monthly | Weekly |
Source: U.S. Dept. of Labor, FL DEO, Burning-Glass
Term Definitions:
- WoW = Week-over-week
- MoM = Month-over-month
- YoY = Year-over-year
Key Takeaways: Week ending September 11, 2020
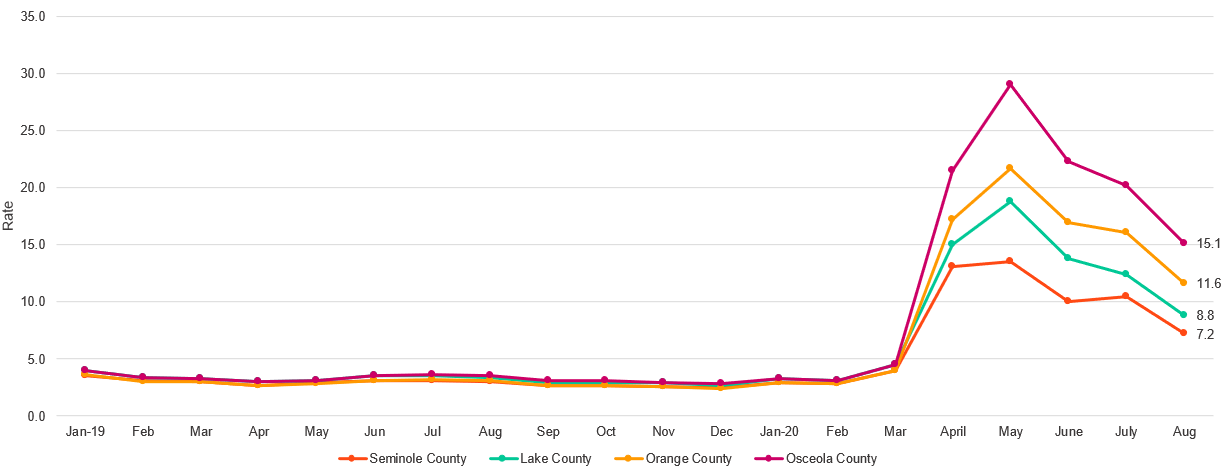
- The Orlando unemployment rate dropped to 11.0 percent in August, down from a revised estimated of 15.4 percent in July. This brings the Orlando region’s unemployment rate much closer to the National rate of 8.4 percent (slide 4). All four counties in the Orlando MSA reported a decline in their unemployment rate: Seminole (7.2 percent), Lake (8.8 percent), Orange (11.6 percent), and Osceola (15.1 percent) (slide 5).
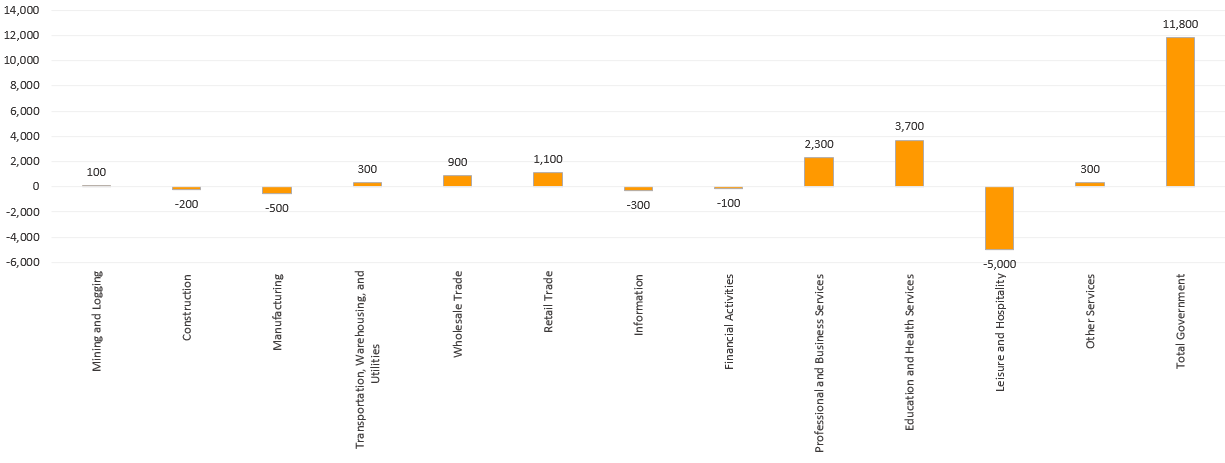
- The region added 14,400 jobs back to the economy from July to August, mainly in government work (slide 9). While jobs returning in the Leisure and Hospitality sector accounted for more than 56,000 in jobs gains from June to July, this month the industry lost 5,000 jobs, signaling the continued volatility of employment in this sector and its dependence on safely reopening.
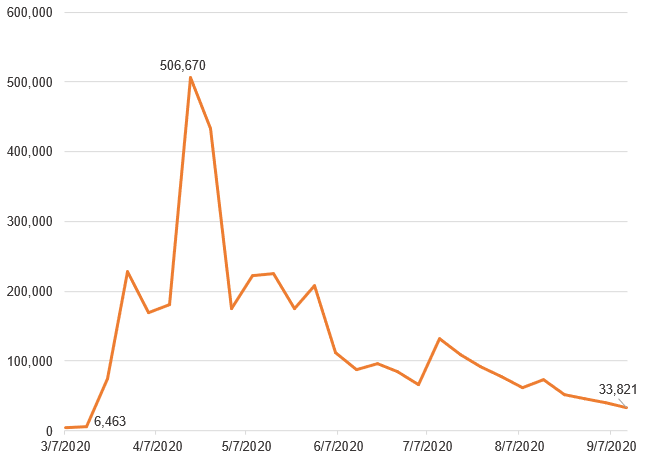
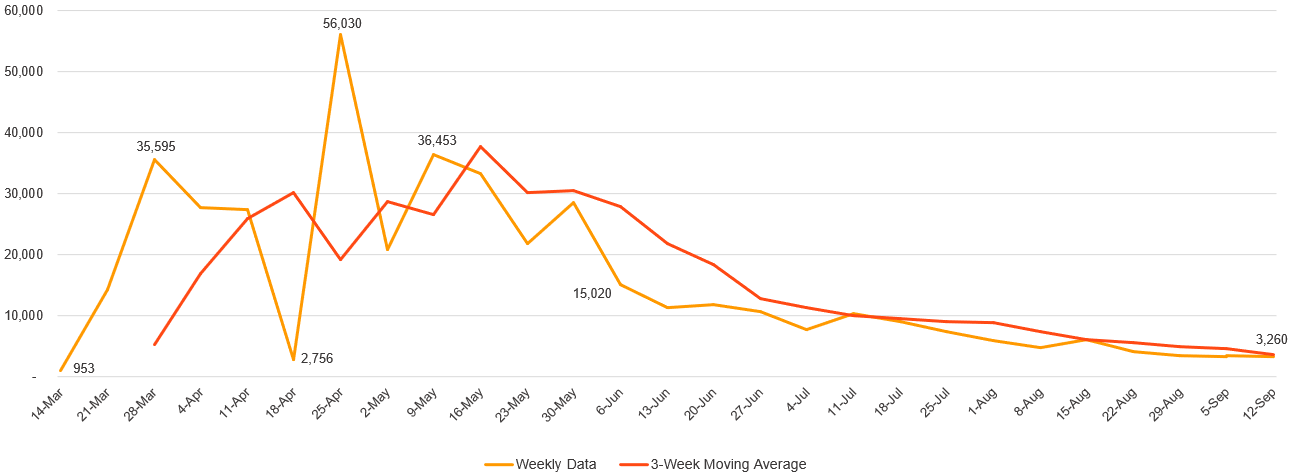
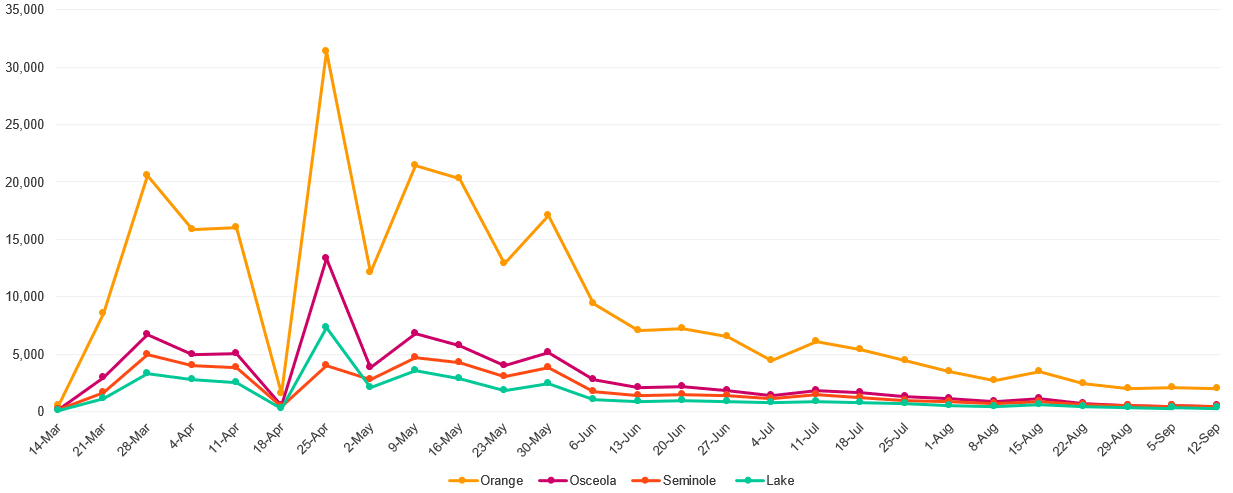
- New claims for unemployment insurance continue to decrease in Florida while the US reported a plateau (slide 6). The number of US claims saw a slight decrease of 3.7 percent, plateauing for 3 consecutive weeks in the 880,000s. In Florida, however, claims are the lowest since the start of the pandemic in mid-March. Florida reported 33,821 in new weekly claims and a downward trend. In the Orlando MSA, claims for unemployment continue to decrease, but are also experiencing a plateau in the 3,000s. In the latest data available, the Orlando MSA reported its lowest number of weekly claims at 3,260 since the start of the pandemic. Claims in all four counties: Orange, Osceola, Seminole, and Lake are experiencing a plateau. It is worth noting, the FL Department of Economic Opportunity (DEO) reports 43.3 percent of Osceola’s labor force have submitted claims for unemployment insurance and 32.4 percent in Orange. These are the two counties in Florida have highest proportion of claims submitted by workers in the labor force.
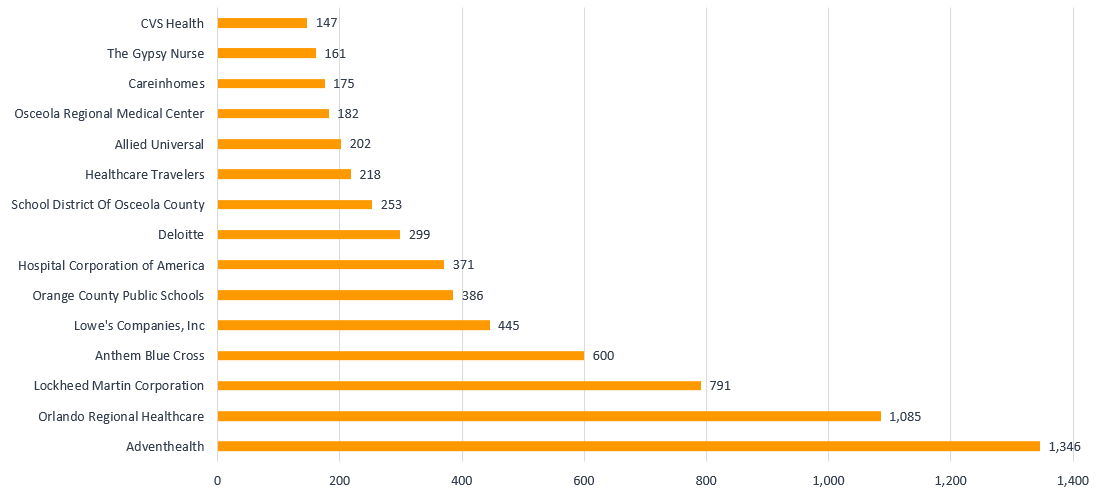
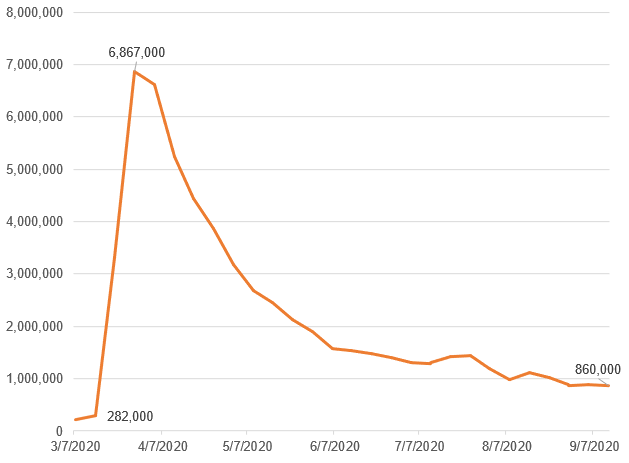
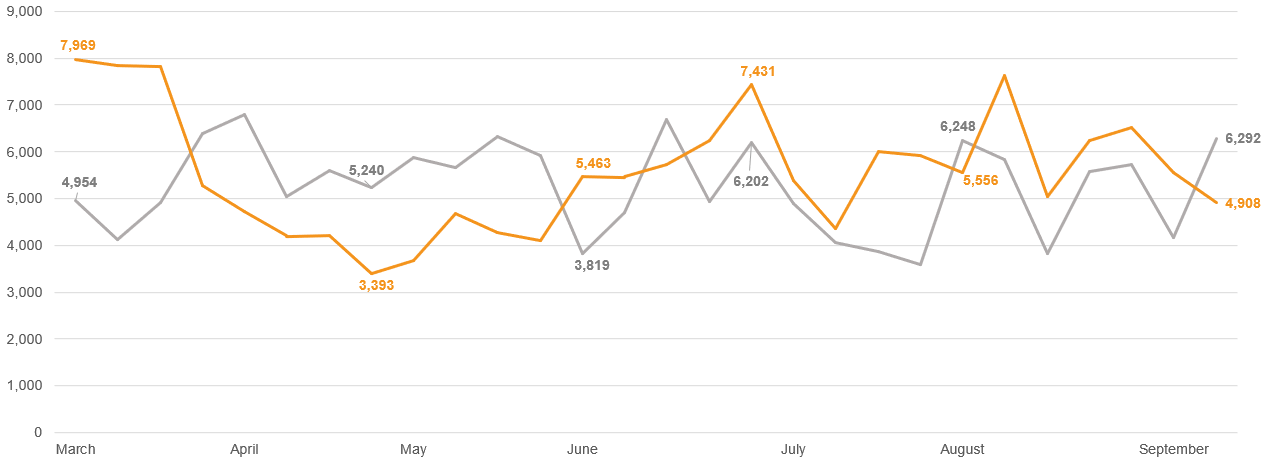
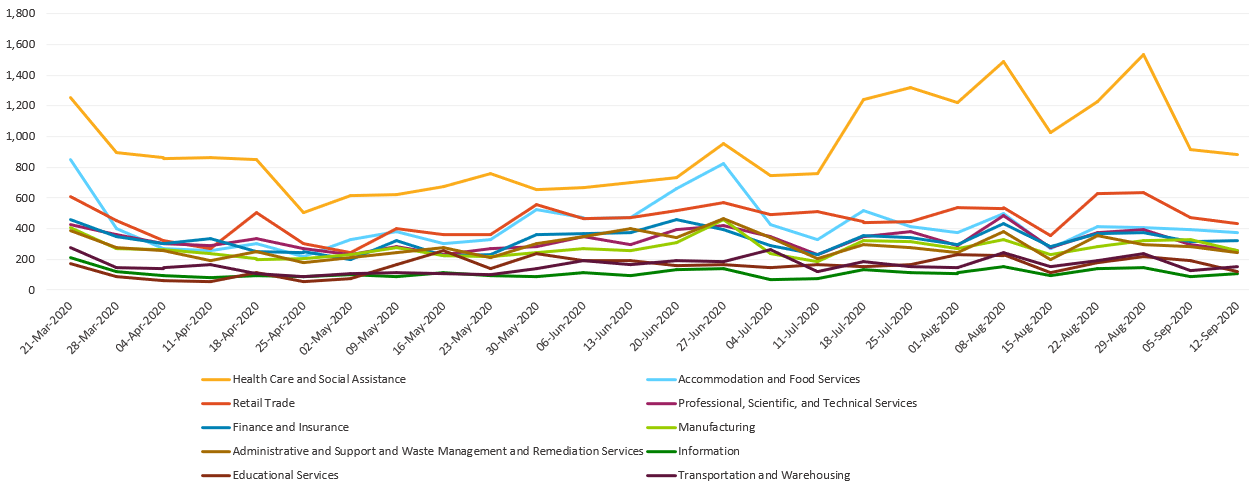
- Job posting data reflects real-time labor market information and business recovery. It also compares how the Orlando MSA labor market is behaving in contrast to 2019. In the most recent week, job postings saw a decrease and 22 percent less posting than this same week a year ago. Slide 11 shows this information broken out by top industries. Posting activity saw a decrease in health care and social assistance, retail trade, manufacturing, and educational services, some of the major contributors to movements in overall posting activity. Employers in hospital and healthcare services, defense and public schools continue to be the major job posters in the region. Note: Job posts do not measure hires and may include companies who continue to post jobs but are on a hiring freeze.
1. Unemployment Rate
2019-2020, NSA
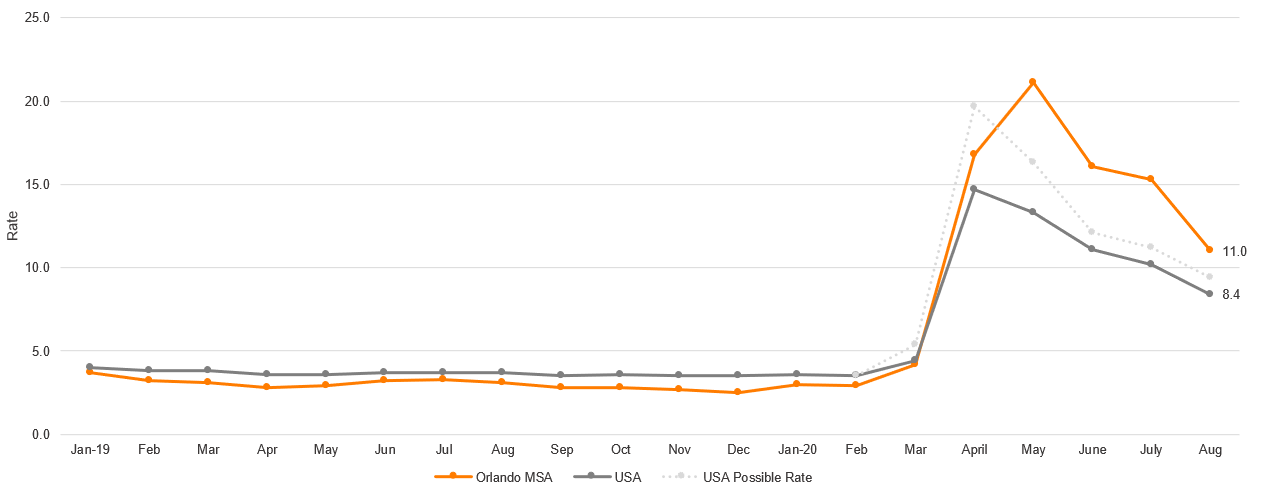
Note: The U.S. unemployment rate for August is 8.4 percent with the Bureau of Labor Statistics (BLS) suggesting it could be up to 1 point higher due to a misclassification of “absent” workers. The noted, possible rate from the BLS is included on the gray, dashed line. Next Update: National Data – October 2
2019-2020, NSA by County
2. New Claims for Unemployment Insurance
U.S., March 2020 – September 12, 2020
Florida, March 2020 – September 12, 2020
Orlando MSA March 14 – September 12, 2020
Orlando Counties, March 14 – September 12, 2020
3. Month-to-Month Job Change – By Industry
1- Month Change in Employment , July – August 2020 (Not Seasonally Adjusted)
Next Update: September data released October 20
4. Job Postings – Time Series Analysis
Total Online Job Ads, Orlando MSA, 2019 vs 2020
Top 10 Posting Industries: Orlando MSA, by Week Posted
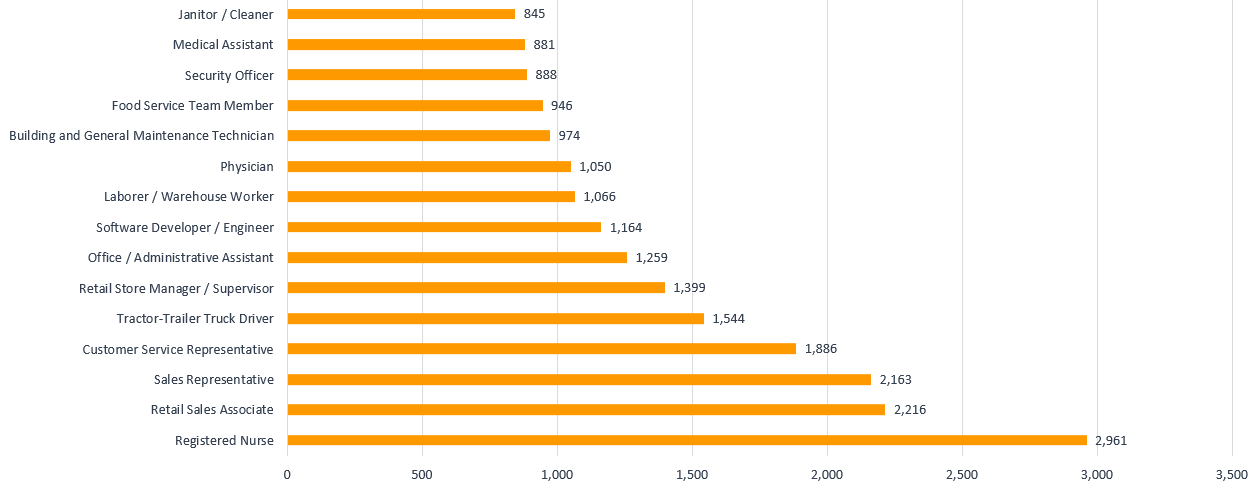
Jobs in Greatest Demand: Orlando MSA, Last 90 Days Ending September 16, 2020
Employers With Most Job Openings: Orlando MSA, Last 90 Days Ending September 16, 2020