
This month we focus analysis on combining 2020 trends in the unemployment rate, industry employment, labor force size, and consumer spending to bring you insights into the emerging opportunities and challenges for the regional economy.
As we seek to help the region navigate the economic disruption, we have insights into new economic data to share with you. The following key takeaways from the monthly jobs report, produced by the Florida Department of Economic Opportunity, highlight the most recent employment data available for the Orlando region (Lake, Orange, Osceola and Seminole Counties).
Released on January 22, the data from this report rounds out labor force and employment data for 2020. This month we focus analysis on combining 2020 trends in the unemployment rate, industry employment, labor force size, and consumer spending to bring you insights into the emerging opportunities and challenges for the regional economy.
Opportunities:
- The unemployment rate in Orlando fell steadily over the course of 2020 from May to December, even continuing to fall when National rate changes stagnated. Orlando’s unemployment rate ended the year at 6.9 percent, much closer to the National rate of 6.5 percent (not seasonally adjusted) and the Florida rate of 5.8 percent. See Figure 1 below. The dramatic decreases in Orlando’s unemployment rate over the second half of 2020 are even clearer when compared to other large metropolitan areas in the US. While Orlando was one of the regions most heavily impacted earlier in the year, over the second half of 2020 the regional unemployment rate fell rapidly to lessen the gap with other Florida metros and is less than the unemployment rate in New York, Los Angeles, and Las Vegas. See Figure 2.
- Three main industries returned to pre-pandemic levels of employment in 2020. The Transportation Warehousing and Utilities, Wholesale trade, and Retail industries currently have employment rates higher than they were in February 2020, eight percent higher in the case of Transportation Warehousing and Utilities. This growth contributed to the strong demand for Customer Service and Retail Sales positions Orlando experienced over the last year as consumer spending in the areas of retail and e-commerce rose well above levels from the same time in 2019. Orlando employment is also performing better than the national average in the Information, Professional and Business Services, and Manufacturing industries. See Figure 3 and Figure 4.
Challenges:
- The pandemic has created massive shifts in consumer behavior and therefore consumer spending, a key driver of economic recovery. While spending has increased in areas such as retail and grocery, consumer spending is still well below pre-pandemic levels in entertainment, transportation, and at restaurants and hotels. See Figure 4. This decrease in spending in the leisure and hospitality space is mainly driven by the lower spending of high-income households and in high-income neighborhoods. While spending for low-income and middle-income households returned to pre-pandemic levels as early as April, spending in high-income households has yet to return to pre-COVID levels. This loss of discretionary spending from high-income consumers is the main force driving job loss in the restaurant, entertainment, and hospitality spaces. See Figure 5.
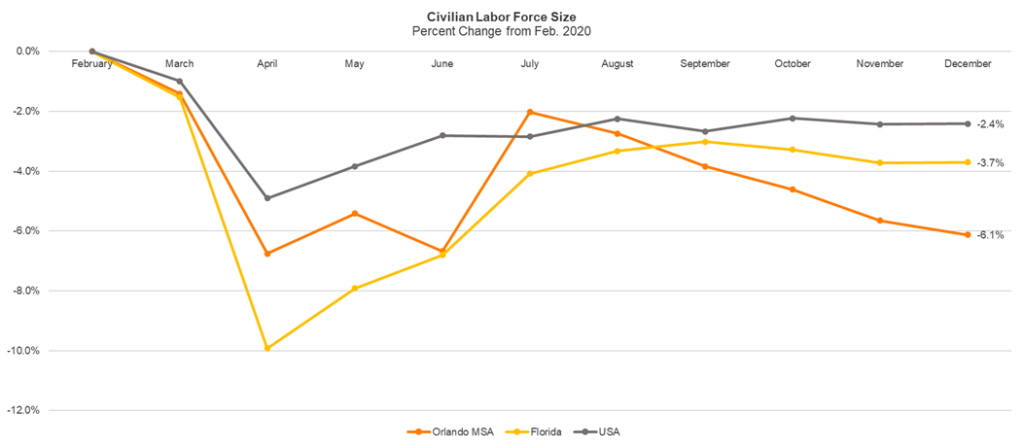
- The impacts of this lessened spending and the loss of available jobs in the Leisure and Hospitality industry continue to bring down the region’s overall employment rates. Roughly one-third of all Leisure and Hospitality jobs that existed before the pandemic are no longer available in Orlando. This continued loss of positions is likely contributing to Orlando’s greater than average labor force loss. The labor force in Orlando (a combination of those people who are employed and those who are actively looking for work) is six percent smaller than it was in February 2020, signaling that that workers previously employed in the Leisure and Hospitality space have stopped looking for work and dropped out of the labor force entirely. See Figure 6.
As we look forward to the remainder of 2021, these trends underscore the importance of focusing heavily on: helping new and existing companies grow in the region, highlighting sources of underutilized talent through skills analysis and rapid workforce development, and creating a regional economy where all individuals have the access to resources encouraging entrepreneurship and innovation.
Figure 1 – Orlando Unemployment Rate
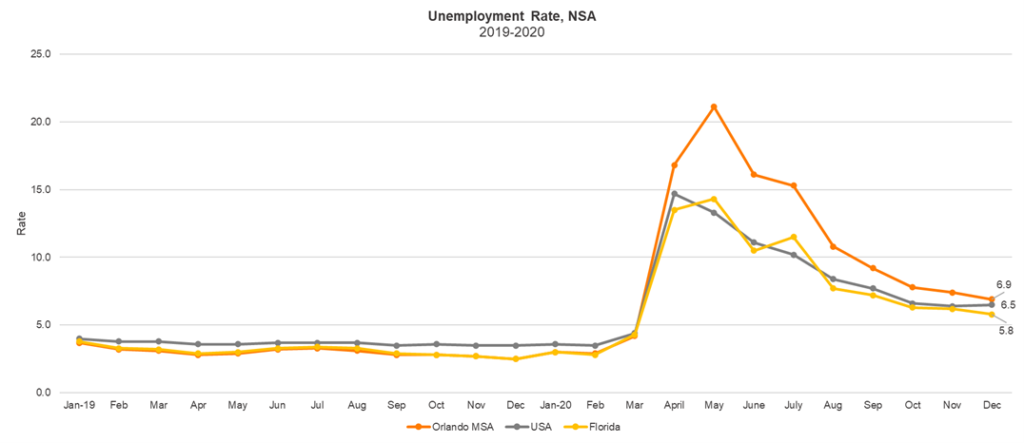
Figure 2 – Large Metro Unemployment Rate
December values not available for metros outside of Florida at the time of publication.

Figure 3 – Industry Employment, Jobs Lost or Gained in Each Industry
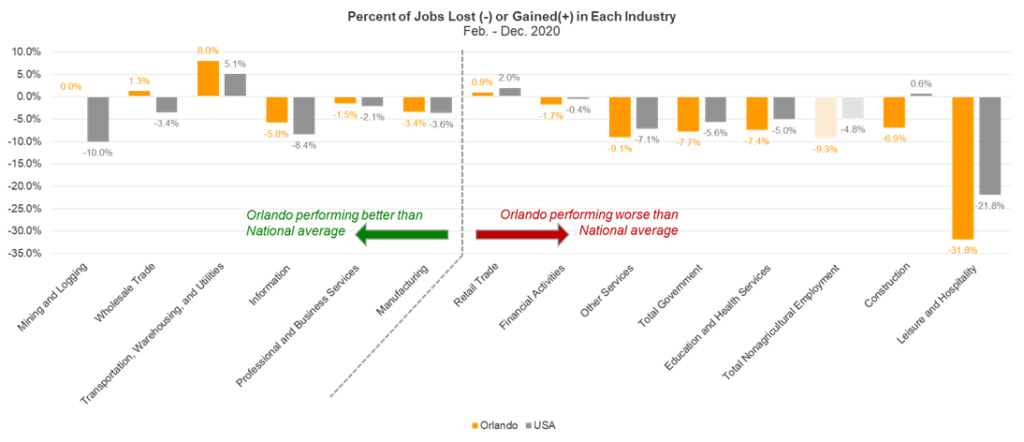
Figure 4 – Percent Change in Florida Consumer Spending by Industry
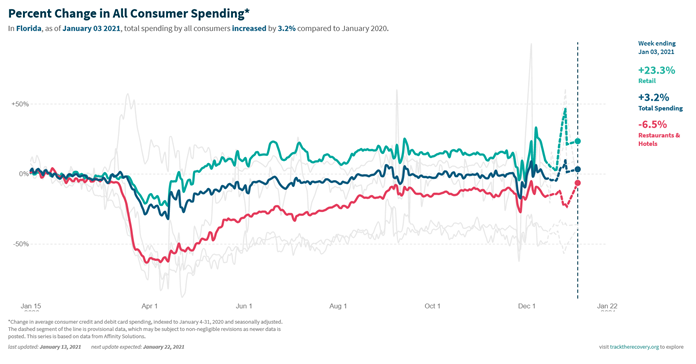
Figure 5 – Percent Change in Florida Consumer Spending by Zip Code Income
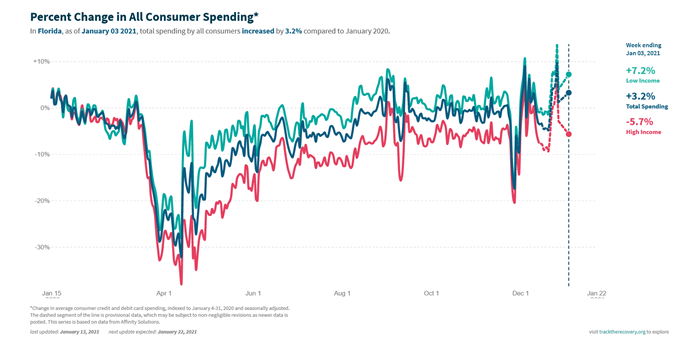
Figure 6 – Percent Change in Labor Force Size from Feb. 2020