
A weekly update to high-frequency indicators through September 11 that will signal worsening or better economic recovery outcomes for the Orlando region.
In this weekly, special edition of the metro Orlando Market Overview, the Partnership research team analyzes select, high-frequency indicators* that will signal worsening or better outcomes for the region. The signs of a deepening recession or the beginning of a recovery will appear in these indicators before they are seen in a wider set of data sources.
Of note, the National Bureau of Economic Research officially declared the US economy in a recession on Monday, June 8. Starting in February, this recession ends a decade-long period of economic expansion and the longest in recorded US history.
The metrics provided below will be updated in new posts on a weekly basis by the research team with the latest data available.
*Lags in data collection and publishing mean that many economic indicators will not begin to quantify the effects of a COVID-19 recession on the Orlando region until Q3 2020 and beyond.
| Unemployment Rate | New Claims for Unemployment Insurance | Month to Month Job Change | Week to Week Job Postings | |
| Metric | 15.3% | 3,444 | 61,400 | 5,435 |
| Rate of Change | -.8% MoM | -16.7% WoW | +5.4% MoM -9.0% YoY | -16.5% WoW |
| Date Range | June | August 29 | June-July | September 5 |
| Released | Monthly | Weekly | Monthly | Weekly |
Source: U.S. Dept. of Labor, FL DEO, Burning-Glass
Term Definitions:
- WoW = Week-over-week
- MoM = Month-over-month
- YoY = Year-over-year
Key Takeaways: Week ending September 11, 2020
- Recently released national data shows the U.S. unemployment rate fell almost two percent to 8.4 percent in August. Among the major worker groups, the unemployment rates declined for adult men (8.0 percent), adult women (8.4 percent), teenagers (16.1 percent), Whites (7.3 percent), Blacks (13.0 percent), and Hispanics (10.5 percent). The jobless rate for Asians (10.7 percent) changed little over the month. Additionally, the number of permanent job losers increased by 534,000 to 3.4 million; this measure has risen by 2.1 million since February. As of July, latest data available, Florida had an unemployment rate of 11.3 percent and the Orlando MSA of 15.3 percent (slide 4).
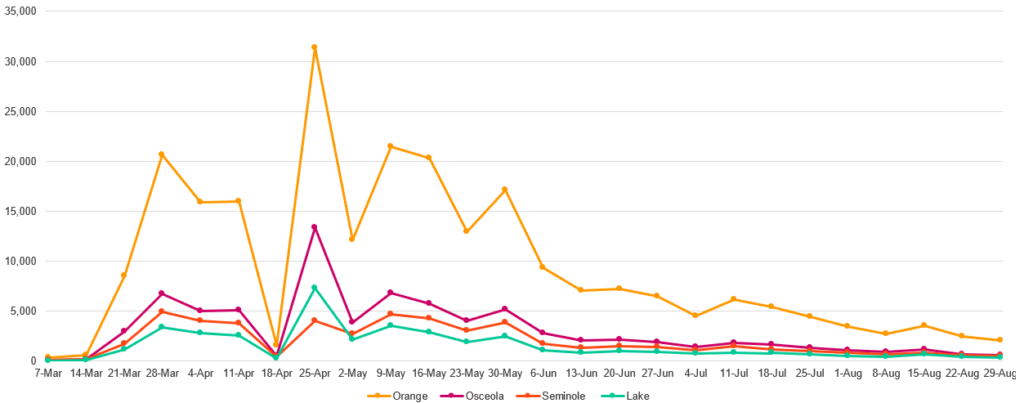
- New claims for unemployment insurance continue to decrease in Florida while the U.S. reported a plateau (slide 6). The number of U.S. claims were reported to be the same as last week, remaining consistent in the 880,000’s. In Florida, however, claims are the lowest since the start of the pandemic in mid-March. Florida reported a little over 36,500 in new weekly claims with a downward trend. In the Orlando MSA, claims for unemployment continue to decline. In the week of August 29, the latest data available, the Orlando MSA reported its lowest number of weekly claims at 3,444 since the start of the pandemic. Claims in all four counties: Orange, Osceola, Seminole and Lake are consistently trending downward.
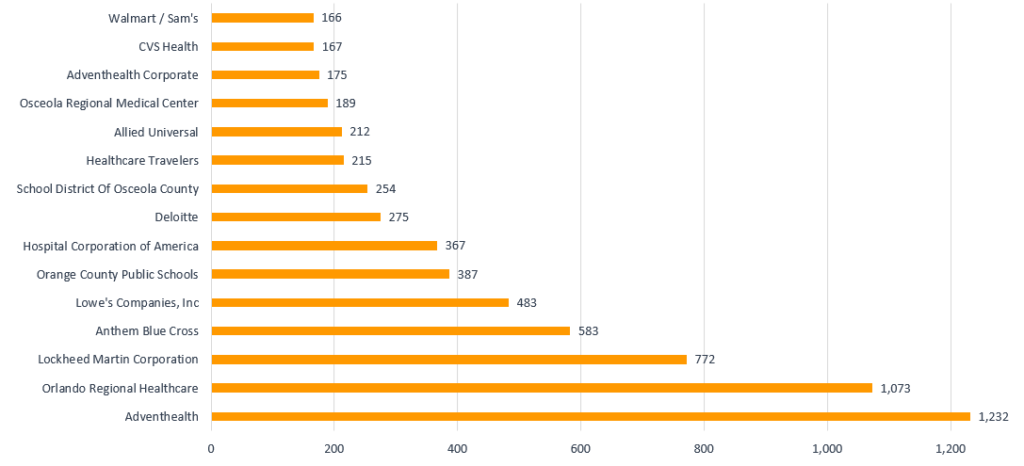
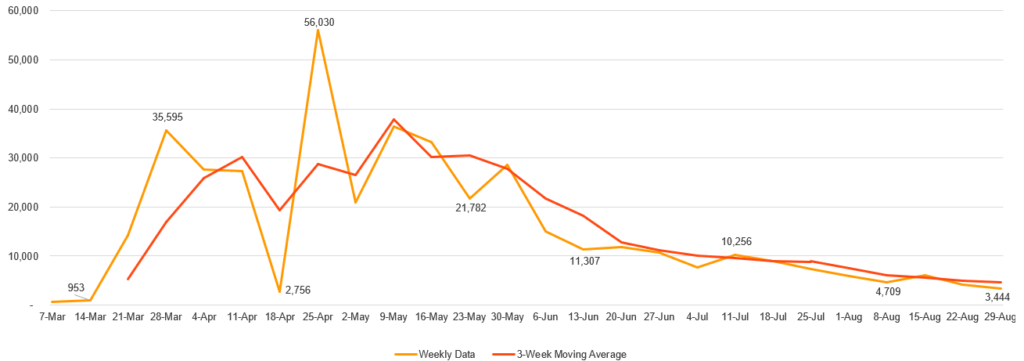
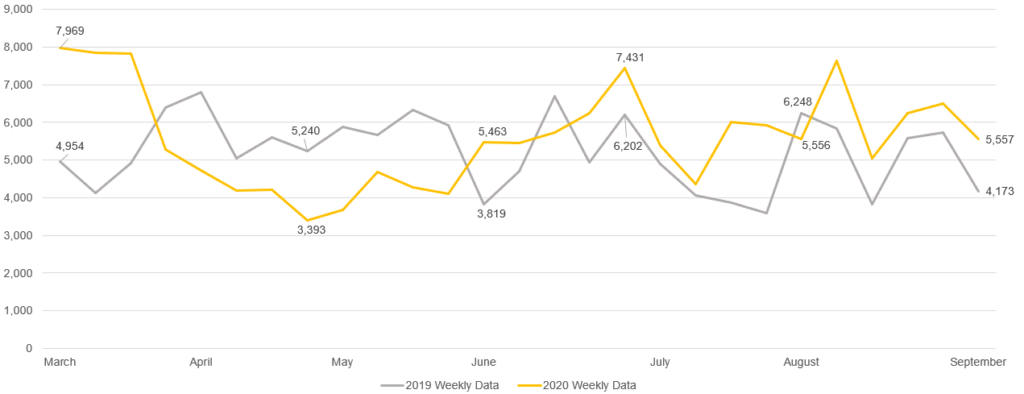
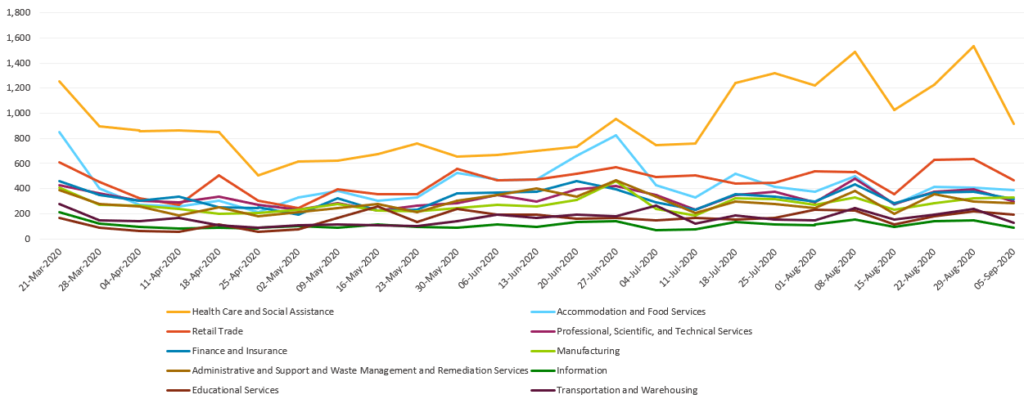
- Job posting data reflects real-time labor market information and business reopening. It also helps compare how the Orlando MSA labor market is behaving in reference to a year ago, 2019. In the most recent week, job postings saw a decrease, but in reference to 2019, there are 33 percent more postings than last year. The three-week moving average reflects an increasing trend of job postings. Slide 11 shows this information broken out by top industries. Posting activity saw a decrease in health care and social assistance, retail trade, finance and insurance, transportation and warehousing, some of the major contributors to movements in overall posting activity. Employers in hospital and healthcare services, defense, and public schools continue to be the major job posters in the region. Note: Job posts do not measure hires and may include companies who continue to post jobs but are on a hiring freeze.
1. Unemployment Rate
2019-2020, NSA
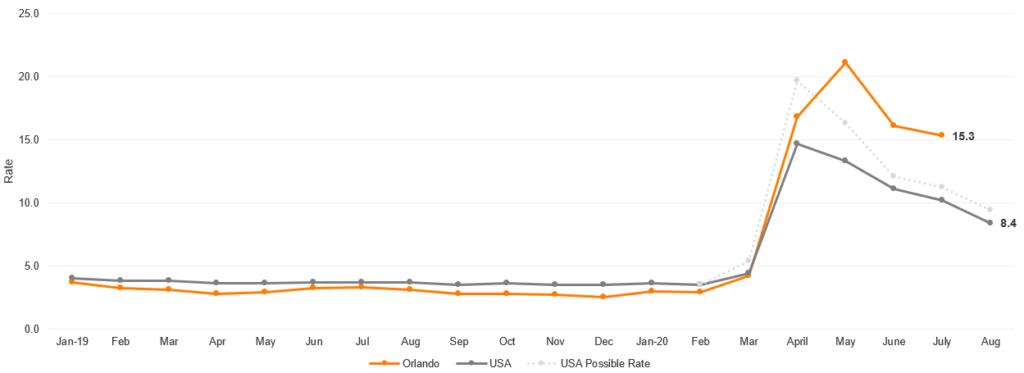
Note: The U.S. unemployment rate for August is 8.4 percent with the Bureau of Labor Statistics (BLS) suggesting it could be up to 1 point higher due to a misclassification of “absent” workers. The noted, possible rate from the BLS is included on the gray, dashed line.
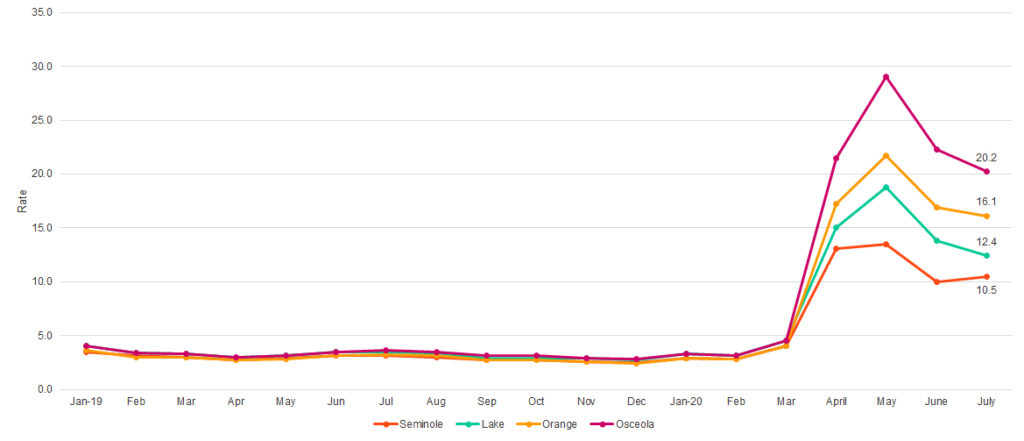
2019-2020, NSA by County
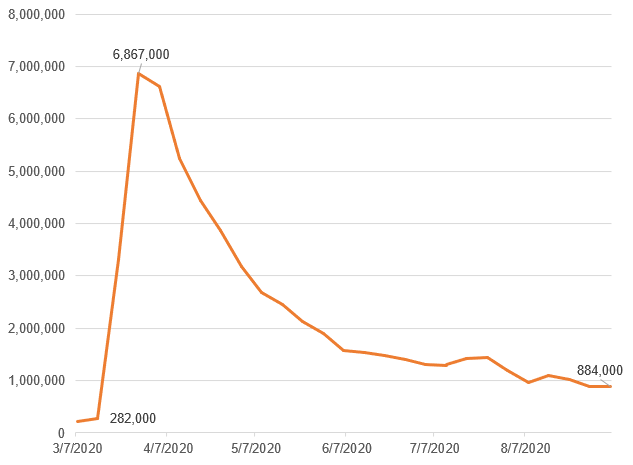
2. New Claims for Unemployment Insurance
U.S., January 2020 – September 5, 2020
Florida, January 2019 – September 5, 2020
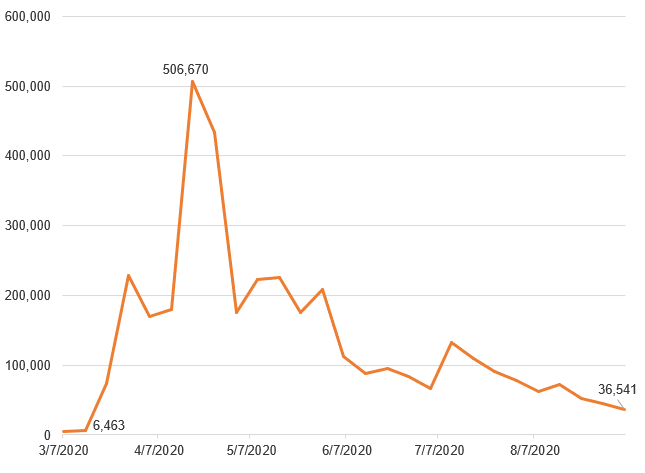
Orlando MSA March 7 – August 29, 2020
Orlando Counties, March 7 – August 29, 2020
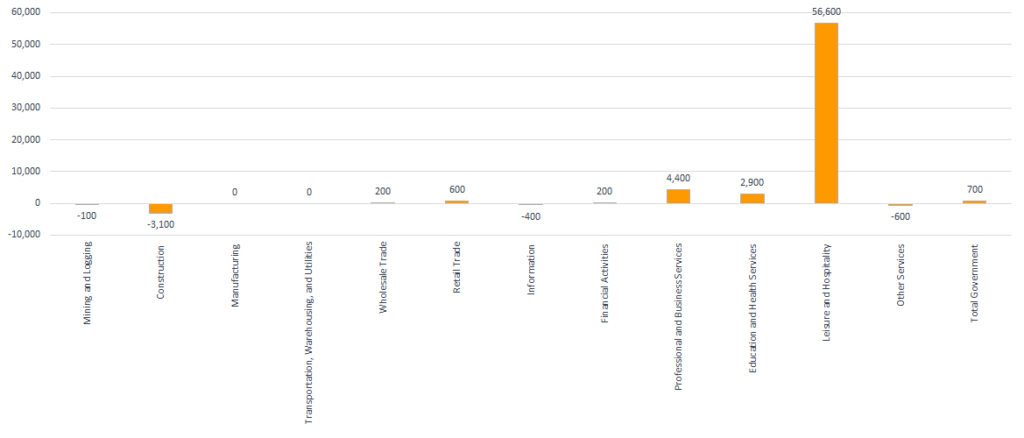
3. Month-to-Month Job Change – By Industry
1- Month Change in Employment , June-July 2020 (Not Seasonally Adjusted)
Next Update: August data released September 18
4. Job Postings – Time Series Analysis
Total Online Job Ads, Orlando MSA, 2019 vs 2020
Top 10 Posting Industries: Orlando MSA, by Week Posted
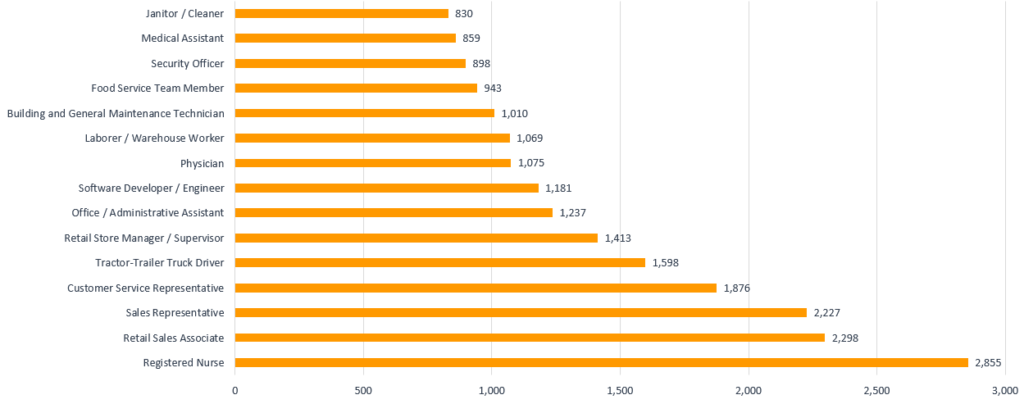
Jobs in Greatest Demand: Orlando MSA, Last 90 Days Ending September 9, 2020
Employers With Most Job Openings: Orlando MSA, Last 90 Days Ending September 9, 2020